Himachal Produced Plastic Waste Of 1,85,168 Tonnes Per Annum in Yr 20-21
2 min read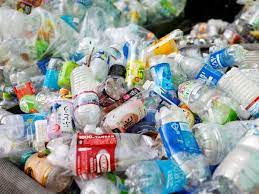
Suggestive Image
Unmanaged and littered plastic waste including plastic packaging waste has adverse impacts on terrestrial and aquatic ecosystems. The Plastic Waste Management Rules, 2016, provides the statutory framework for plastic waste management in an environmentally sound manner throughout the country. Considering the adverse effect of littered single use plastic items on terrestrial, aquatic and marine ecosystems, the Ministry notified the Plastic Waste Management Amendment Rules, 2021, on 12th August 2021, prohibiting identified single use plastic items, which have low utility and high littering potential, from 1st July 2022. The Ministry of Environment, Forest and Climate Change has also notified the Guidelines on the Extended Producer Responsibility for plastic packaging vide Plastic Waste Management Amendment Rules, 2022, on 16th February, 2022.
As per Annual report of Central Pollution Control Board (CPCB) on the implementation of Plastic Waste Management Rules, 2016, the plastic waste generated in the country during the last five years are given below:
| S. No. | Year | Plastic Waste Generated (Tonnes Per Annum- TPA) |
|
|
2016-17 | 1,568,714 |
|
|
2017-18 | 660,787 |
|
|
2018-19 | 3,360,043 |
|
|
2019-20 | 3,469,780 |
|
|
2020-21 | 4,126,997 |
The plastic waste generated state-wise and year-wise as per Central Pollution Control Board Annual reports have been provided in Annexure I.
The total Extended Producer Responsibility (EPR) of registered producers, importers and brand owners for plastic packaging is around 3 million tonnes for the year 2022 – 23, under EPR Guidelines. The EPR certificates generated by registered plastic waste processors after processing of plastic packaging waste including recycling is 2.5 million tonnes.
Annexure I
Year wise data for Plastic Waste Generation as per CPCB Annual Reports*
(* consolidated based upon information provided by State Pollution Control Board / Pollution Control Committee)
| S. No. | States/UTs | |||||
| 2016-17 | 2017-18 | 2018-19 | 2019-20 | 2020-21 | ||
|
|
Andhra Pradesh | 82863 | NA | 66314 | 46222 | 39626.45 |
|
|
Arunachal Pradesh | NA | 6 | 3787.37 | 2721 | 3755.9 |
|
|
Assam | 24030 | NA | 32277.87 | 24971 | 58765 |
|
|
Bihar | 2280 | 2280 | 68903.328 | 41365 | 74263.69 |
|
|
Chhattisgarh | 7300 | NA | 6000 | 32850 | 47450 |
|
|
Goa | NA | NA | 32580.52 | 26068 | 29441 |
|
|
Gujarat | 269294.88 | 269808 | 356873 | 408201 | 337693.96 |
|
|
Haryana | 23369.09 | NA | 68735.26 | 147734 | 185168 |
|
|
Himachal Pradesh | 255 | NA | 3672 | 13683 | 6206.78 |
|
|
Jammu & Kashmir | NA | 27870 | 34367.37 | 74826.33 | 51710.6 |
|
|
Jharkhand | NA | NA | 51454.53 | 43332 | 20263.45 |
|
|
Karnataka | 419600 | NA | 272776 | 296380 | 368080 |
|
|
Kerala | NA | NA | 133316 | 131400 | 120063.87 |
|
|
Madhya Pradesh | 50457.07 | 61037 | 72327.39 | 121079 | 138483.58 |
|
|
Maharashtra | 21420.33 | NA | 409630 | 443724 | 311254 |
|
|
Manipur | NA | 24 | 12453.8 | 8293 | 10303 |
|
|
Meghalaya | 13.265 | 15.096 | 1263 | 5043 | |
|
|
Mizoram | NA | NA | 13.306 | 7909 | 1514.51 |
|
|
Nagaland | NA | 14052.5 | 268.18 | 565 | 4785.94 |
|
|
Odisha | 6890.805 | 12092.205 | 90138.98 | 45339.4 | 51269.9 |
|
|
Punjab | 163423.4 | 54066.1 | 119414.64 | 92890 | 108332.06 |
|
|
Rajasthan | NA | NA | 104704.383 | 51966 | 66324.57 |
|
|
Sikkim | 102.7 | NA | 5.66 | 69 | 82.75 |
|
|
Tamil Nadu | 79114.792 | NA | 401091 | 431472 | 430107 |
|
|
Telangana | NA | NA | 183014.65 | 233655 | 472675 |
|
|
Tripura | 30 | 28.5 | 26.2 | 32 | 61.65 |
|
|
Uttar Pradesh | 152492.6445 | 206733.4505 | 254401.8 | 161148 | 375950 |
|
|
Uttarakhand | NA | NA | 31093 | 25203 | 18647.75 |
|
|
West Bengal | NA | NA | 300236.12 | 300236 | 417925 |
|
|
Andaman and Nicobar Islands | 365 | NA | 1850 | 387 | 492.342 |
|
|
Dadra and Nagar Haveli and Daman and Diu | NA | NA | 1947.7 | 1948 | 4726 |
|
|
Chandigarh | 21516.75 | 12775 | 11715.4 | 6746 | 13107.15 |
|
|
Lakshadweep | NA | NA | 148 | 46 | 523.54 |
|
|
Delhi NCR | 232732 | NA | 224810 | 230525 | 345000 |
|
|
Puducherry | 9252.25 | NA | 8433 | 11753 | 12754 |


